|
2/23/14
- The markets came roaring back but stopped short twice at the SGB
short signals that started the big drop. If the SPY manages a move over
the SGB's that will be the line in the sand for the Bears to try and
pull it all down. I plan to continue holding my safety net strategy with
Puts on the SPY from week to week because I know that the next turn for
the worse will be much larger than the last one and you just have to be
ready to catch.
So what strike's do we go with? That is a hard one to pick, so I am
looking for staggered entry points based on the last move which was 6
points. The goal is to always end up ITM by expiration, so if you are
playing the weekly options, then you want to buy closer to the action
$2-3 below; otherwise, buy monthly options and stay no more than $5 out
of the money. Now if you are looking strictly for insurance, then buy at
least 2x the volume of contracts that you hold in stocks and/or long
plays.

The markets had the recover bounce, but until they take out 16,500, they
will be vulnerable to a long lasting side ways move or decline. The M
pattern is the signal to begin the turn for the worse and if 16,200 is
not taken out, we need to be very cautious on aggressive long positions.


===============================================================================================================
12/7/13 - New heights again and again
with no signs of stopping the rest of this year. The DOW, NASDAQ, SPY
and Russell indexes are making nothing but new highs daily which has
investors that play the contrarian side (me being one of them) pulling
out all their hair in disbelief as they just keep getting short squeezed
up, up some more and up up and away. These next three weeks of trading
will no doubt test the resolve of the bears as we have the makings of a
a parabolic move about to happen on the weekly chart. In my last
comments below, I was pointing out the triple M pattern and that did not
produce the massive drop I was anticipating. What was missing was a
clear SGB (solid green bar) signal at each top, so that is what I am
looking for now and until that happens, I am sticking to the bullish
side of trading the rest of this year and into 2014. Now that the DJ-30
has completely wiped out that M pattern, I am marking this triple top as
my major support. Looking over the weekly chart, we need to see the
DJ-30 make a solid move back over 16,200 and the Bear will no doubt give
up for 2013 and drive this market right on through—maybe even hit
17,000!
I will still keep some SPY puts in play
just in case this massive bull run ends. In my experience, moves like
this always turn ugly in a single day and you can miss out on some HUGE
gains if you are not in play. I will just figure my cost of trading puts
and compensate with my long plays to cover it. Once the turn comes (and
it will eventually) I will load up on Bear Call Spreads once the DJ-30
moves back under 15,700 on a weekly chart.
The DJ-30 completed 8 weeks of powerful
highs and this week was the test that appears to have failed the bears.
They will no doubt attempt to bring down the markets this coming week so
if they cannot take out last weeks low, then it's over for them and the
party continues for the Bulls into 2014. With Friday's impressive
unemployment report, I am anticipating the DJ-30 to gap open on Monday
an the squeeze to begin. If that happens, the Bears will just have to
concede defeat and off to the races we will go. For me, the pivot point
is 16,213.00 and my 2013 upside target is 16,790.28.


===========================================================================================================
10/9/13 - Spooky times approaching as the
markets (investors) begin to realize this government shut down
could really mean financial collapse for the US of A. We need a real
capitulation event to drop this market from on high and it won't take
much more to create a stampeded for the exits. Yesterday the markets
started to come to the realization when comments were made by select
republican congressional leaders at a news conference. They (meaning ALL
OF THEM IN the Con-grass-smokers-ass-sociopath-ation up there on high)
were setting up (actually setting the stage) for a real down-to-the-wire
game of financial chicken with the President. If these two really go to
the end, the markets will see the end of this massive rally for 2013. We
are already down now 1,000 points for the third time this year and if
the daily and monthly charts are correct, then we are poised for a
horrible ending to a stellar year.
Taking a close look at the daily chart,
it looks UGLY! But it's always darkest before the dawn right? Well if
you change one letter you get DOWN...lol.
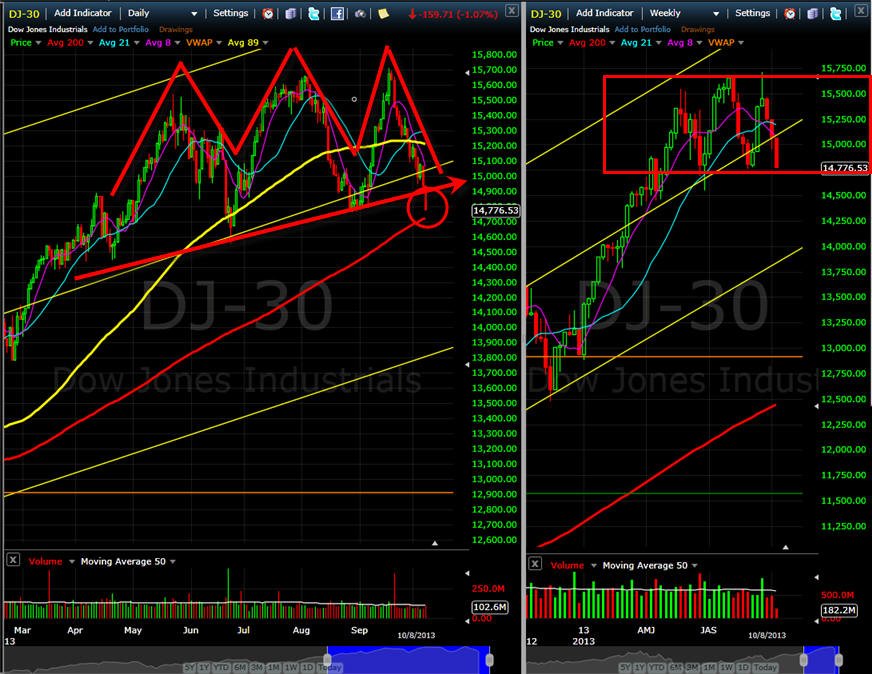
As I pointed out below the DOW was
putting in the infamous "M" pattern indicating the Index was about to
get murdered, but that was postponed as investors bought the bottom of
that test and a massive 1,000 point rally took center stage taking out
the all time highs and setting a newer one. Well, we are back to the
bottom with a second consecutive "M" pattern and this time it may be the
END for the Dow. The only saving grace on the daily chart is the 200MA,
and if that is taken out this week, then we could be in for a massive
crash and burn for the rest of 2013.
Today's trading action was controlled but
a steady decline was going on all day with all the leader stocks were
dropping MORE than the DJ-30; and that is a strong indication that BIG
money is leaving the game table. When you see controlled, consistent,
selling, that is market movers manipulating price action so they can get
out; when you see massive capitulation drops, that is when BIG money has
STOPPED buying. The next couple of days are going to be pivotal—in my
professional opinion—setting the tone for the rest of the years trading.
Of course it's never easy to predict the
final outcome, but if the government political game of chicken does not
get resolved soon, investors will hit the sell (take profits) button and
we are in for a precipitous drop. How do you play this one? It's a
difficult choice in deed because all the puts are not cram packed with
pumped up premium so anything you buy on the short side has a
diminishing of returns effect. The solution is to SELL PREMIUM on the
short side and speculate on the long side because if we get a relief
rally, it will be almost instant and fast. In order to get the maximum
benefits, you have to be willing to buy when everybody want to sell. The
challenge is and always will be getting the perfect timing down. Well my
trading friends. you will never get the timing down so you just have to
buy enough time to let things work themselves out.
The weekly chart also has a multi "M"
pattern, but it still has another 200+ points to go before it's a total
breach of the bottom. More interesting to me is the Fibonacci moves. We
have 34 weeks topping out into this week being the 13th one testing that
"M" pattern bottom. Another support bounce could be the kick off and a
breach the beginning of disaster. Either way, I am expecting a BIG move
to start this week and that could have been ignited today. So long as
the DOW stays UNDER my T1 target on this weekly chart, I am BEARISH.

The monthly chart is setting up for
the next massive move and if we get one like last time, we can easily
see a rapid drop of 1,000 or more points in the DJ-30
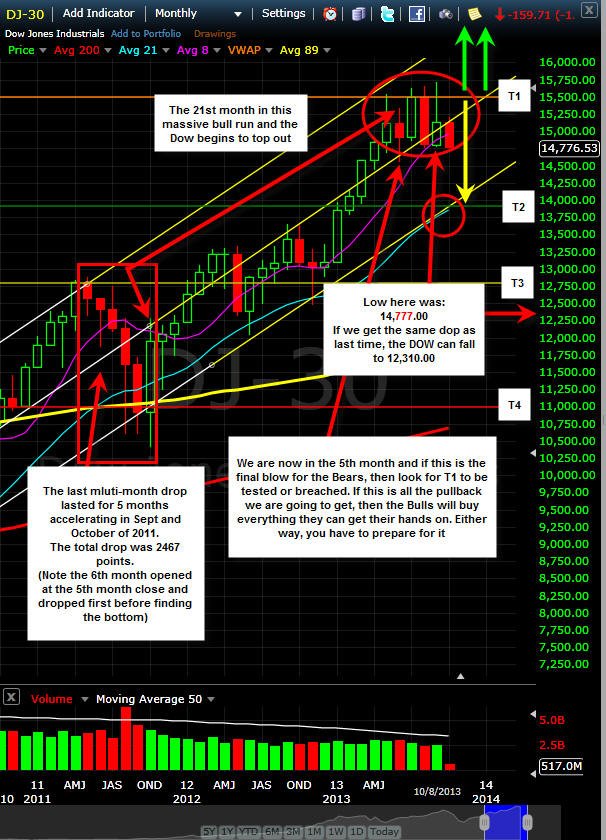
Looking deeper into a quarterly chart we
have a LONG WAY TO DROP .

The last multi-quarter drop started back
on 12/2009 and lasted for over 2 years resulting in a 7,720.05
decimation—that total move was just under 55%!

Get ready for some exciting trading times
ahead!
Profits UP!

The donFranko
==================================================================================================================
9/3/13 -
The month to set the tone for the rest of 2013. September is known as
the beginning of crash season and with war looming on the horizon, the markets are
certain to be skittish to DOWN. So far T1 has been clearly taken out and
if the current monthly bar turns red then I am looking for T3 to be the
stopping point. My long term trend channel has been violated at the mid
point which is very bearish so we could be in for a pretty big drop in
September. Last year, this month was actually strong and then the
markets kicked into selling down sharply. In 2011 September was the
capitulation month that kicked off a huge multi-month rally so it's
going to be an exciting final quarter for 2013 no doubt. It is becoming
a foregone conclusion that Ben Bernanke is stepping down as the Fed Chief
and the hunt for a new candidate is being floated in the news channels.
Most are expecting
Larry Summers to win the post, but I think if that is the case, we
could be in for a precipitous drop in all the markets!

Taking a look at closer time frame and
both these charts are screaming "M"URDER. The hard part about this
pattern is it's easy to spot and when you can clearly see it, the move
has almost always been completed. In this case, the DJ30 has dumped from
all time highs and is now trading under a very strong psychological
level...15,000. If we go to war, I fully expect this to continue an test
T2. If we resolve the Syrian crisis quickly, then I fully expect the
markets to rebound.
Now if the markets are truly controlled
(and I fully believe they are) then war will bring initial panic selling
and the arbitrage computers will be kicked on and markets will stabilize
and rise. After all, nothing brings the American economy back stronger
than a good war; and if they distract us with a rising market, low
interest rates and improved employment, we tend to forget about the
killing of other people in far off countries. Just give us our fast
food, sports and movies and we'll be just fine.
Well, this time around, the propaganda
machine of warmongers is losing it's ability to fool most Americans and
many armed forces patriots are waking up to bullshit politicians playing
a game of RISK with their lives. They are posting signs they are NOT
going to fight in a civil war for Al-Qaida. After all, aren't they over
there fighting against Al-Qaida? Wouldn't it be nice if politician so
eager to go to war had to actually SERVE on the front lines FIRST before
they could vote to send our youth to their deaths? Let's hope this turns
into a non-event and we can concentrate on educating people to live
together rather than die together.
Be prepared and keep a running tab of
PUTS on the SPY as part of your cost of trading. That way, if this turns
into a disaster, your accounts can be protected from devastation because
the initial drop or plunge will happen far quicker than you can react to
it.

Profits UP!

The donFranko
======================================================================================================================
8/11/13 - July was a strong month
for the DOW testing and closing above the May high which was impressive
indeed. August is typically a down month in the DOW and so far, 2013 is
showing signs of repeating history. The last pull back was a short two
months and started after August of last year, but we may get an early
start this month since earnings have been average. There is wide
speculation and rumors that Fed Chairman Ben Bernanke is ready to
announce his retirement. If that happens in the next month or two, this
will create a tremendous amount of uncertainty; and investors have
massive profits to protect; so it stands to good reason the markets will
start a corrective phase that can easily accelerate.
So, how do we determine when that can
happen and how far it can go down? I love to use my Bull 180 strategies
and my world famous T-Targets to (most of the time) accurately predict
support levels; and boy do we have a great set up in place right now.
The DOW has climbed for 8 months since the last mini-pull back and is
currently in the 21st month since the last multi-month correction; which
are both Fibonacci numbers, and you know how I like those Fibo's for
trade signals.
I have been looking over hundreds of
charts this weekend and I can definitely see some cracks in the floor of
many strong stocks. This, to me, is a definite indication that
institutional money is lightening up. The BIG tell for me is if PCLN can
take out $1,000, and then GOOG starts to move back over $900 on heavy
volume. I am also looking for AAPL to get back over $500.
If the rumors become truth that Bernanke
is indeed leaving, I will be watching these stocks along with several
others on the MONTHLY charts for confirmation of the next multi-month
corrective phase.
PCLN, GOOG, PCLN, AAPL, NFLX, TSLA, LNKD,
AZO, CMG, AMZN, MA, EBAY, IBM, ICE, V, RL, GS, CELG, WYNN, BIIB, ISRG,
BLK.
When markets correct, some stocks thrive
as money leaves high flyers, it has to be placed in solid companies, so
when you see unusual strength in stocks like: KO, GE, MSFT, GM, F, K,
PM, PFE you know, the bellwether or cyclical type stocks, then you can
begin to trust the correction is going to last for a little bit.
The key level for me is T1. If the DJ-30
falls under this level, then I will become more aggressive on my SPY
puts and start looking at selling call premium on the big stocks. On the
other hand, if the monthly chart for August turns green, then I will be
looking for the markets to head to 1600. I am cautiously bullish until a
clear reversal signal has revealed itself.
Profits Up!

===========================================================================================================
7/11/13 - NICE DAY to be long the
SPY! Congrats if you have my long plays on!! The DOW blasted through
resistance and made a new ALL TIME RECORD CLOSING HIGH today...WOW! If
this holds up, and it most likely will, we are heading to DOW 16,000!!
On the other hand, if earnings are horrible for many of the heavy
hitters, look out below right? Well, that may not be the case with the
Federal Reservoir of cash continuing to be pumped in. Of course, this
story cannot keep playing out forever, and when the change up comes, it
could be so massive we never recover for the next decade.
Markets move, and if you do not learn how
to move out of the way when you are a contrarian, they will crush your
account! I have been a strong contrarian on the SPY for months, and let
me tell you, it has been painful to just keep buying puts week after
week.
When the pull back finally came, it was
for only 5 complete weeks and one partial week for a total of 6.8%
before the bottom was hit. The snap back has taken three weeks to erase
just about all of it, and it's looking very strong for tomorrow to close
wiping out all the intra-day high wicks. If that happens, we are in for
one hell of a ride going forward if earnings are strong.
I am still going to keep buying puts (old
dog) as my account hedge, but I am going to speculate with OTM long
calls a month in the future. For me, the keys to the vault are based on the
DOW not falling back under 15,200.
NOTE: Tomorrow is the 13th day in this
impressive run on the Dow and it happens to be a Friday...hmmm...Friday
the 13th day of trading? Coincidence or the sign of the end? We will
know in the next couple of weeks as earnings roll out.


OK, so let's look over the monthly SPY
charts for my contrarian POV.
As you can see, I have it set up as a
BEAR 180, but so far, it is FAILING now that the SPY closed over T1.

Here is what I see in the Daily and
Weekly charts:

Profits UP!

The donFranko
==================================================================================
7/10/13 - The Bernanke speaks and
the markets appear to like it. The SPY advanced (barely) today, but in
after hours trading its up nicely so far.
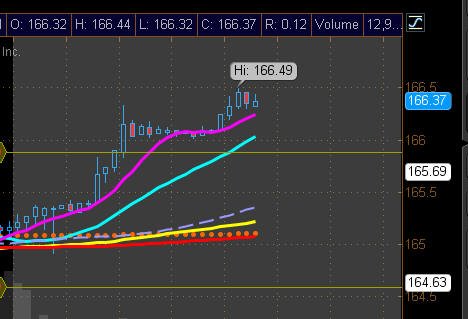
With the hope of a strong earnings
season, we could see continued upside pressure into next week. The daily
chart looks like the SPY is climbing a wall of worry with all these
DOJI's so any "bad" news and this sucker is going to crash in 1 to 2
days of trading. I am keeping my put hedges going and preparing for
earnings season as we get going full speed next week.

Profits UP!

The donFranko
=============================================================================================
7/8/13 - The earnings season has
kicked off and the SPY finished the day with yet another long wicked
DOJI. It will take a week for a clear direction to show itself, so get
ready for some shake ups and shake downs. I bought my weekly hedge and
will place my next one on Friday.

Profits UP!

The donFranko
======================================================================================
7/6/13 - The first clear direction
out of the DOJI fest is UP. With earnings season kicking off this week,
we are in for some moves on the SPY, so I am going to start a hedge this
week with puts. I tested the action Friday getting long the SPY and made
a little profit. The daily chart has completed 8 trading days of
multiple DOJI's with 6 of those day being up so do NOT fight the trend
nor the Fed...I am going to just buy weekly some puts at least 3:1 over
my July13 calls on the SPY and see what the week brings.

Profits UP!

The donFranko
==========================================================================================
7/2/13 -
What a DOJI-fest we are having with the SPY. How can you
make any clear direction decisions when the daily chart
looks like this one? All I know is when this ETF/Market
finds itself, the next move will be a definitive one.
The way I find a better
direction indicator is to keep an eye on longer term charts,
and since we just started July trading, we can use the
monthly chart as our best guide. Below, I suggested that if
July starts out with a Red candle that we get short as the
monthly chart is setting us up for a Level 2 Bear 180 from
June's red candle. With two day under our trading belt, we
can not really take a clear directional bias but I think
this earnings season is going to be a move and a shaker for
the SPY.
Ok, so what do we do when the
monthly chart has a Bear 180 and the weekly is in a Bull
180? We sit it out or speculate with a straddle and add to
the winning side. I am going to put on a July13 straddle
tomorrow to start, and wait for earnings season to kick in
before I overweight one side. Of course, I always prefer the
PUT side so we will see how things begin to play out.

I am taking the entire 21
month rally to figure my Bear 180 T-Targets because if this
earnings season is a bust, the SPY is going down for the
count in my current estimation.

Profits UP!

The donFranko
============================================================================================
5/30/13 -
Tomorrow is the big decision day for the markets. Will it be
a delayed sell in May and go away or do we begin the summer
with a blast off?
What
everyone expects is usually wrong, so all you hear right now
is correction, correction, correction and since I am a
contrarian trader, all I want to be is on the other side of
the prevailing opinion.
The problem is, I love to be
on the short side, and there is where I have difficulties
with getting long. Of course, I have been buying puts every
week as the SPY powered higher and higher, but those were
for hedge purposes and a cost of doing my trading business
so I am not crying over it.
The charts are strongly
indicating we are at a massive TOP, but when investing
public is apathetic or overly enthusiastic, what you see is
NOT necessarily whatchya gonna get.
Looking over the daily chart,
we have quite a bit of exchange in the past 5 trading days
showing definite shuffling of money. Notice the very large
wicked engulfing candle back on 5/22/13 that was followed by
two open red candles and then the infamous SGB! Under normal
circumstances, this would be a MASSIVE short signal, but we
are not in "normal" circumstances. We are in NEVER NEVER
LAND and when you are there, fantasy trading is the
nomenclature.
If we have the Federal
Reservoir of Cash still pumping, then you have to just keep
you foot on the long gas pedal...even when the road gets
bumpy.
I am sticking to my SPY puts
as my overall account hedge, but I am long side biased on my
other trades. What I am definitely looking forward to is the
volatility to pick up so I can have much better odds of
getting filled on my White Whale fishing orders.
My best advice for tomorrow
and into next week is to lower your exposure on either side
and get ready for a nice ride. You never "miss" anything as
a career trader, so DO NOT CHASE direction, just work your
trades and manage your winners.
Currently the SPY is in a
BEAR 180 setup on the weekly chart so I will be a LONG buyer
at the green circles and T3 when the SPY pulls back (if it
pulls back).

Profits UP!

The donFranko
=======================================================================================5/27/13 - May
Day! May Day! Is that what the pundits will be ranting about
this week as we head into the final trading days of May? I
have been watching the markets, reading financial intel and
following my trades with optimistic enthusiasm. So far, all
the signs signal calm seas and rising tides—as you know, a
rising tide will lift all ships and that is what is
happening with the the indexes across the board...they are
all rising!
With indexes and stocks
continuing to make new high after new high, this makes
contrarian investors like myself a wee bit nervous because
we keep attempting to get short; only to be stopped out or
wiped out if you are too aggressive. When the markets are in
euphoric mode, you should be extremely cautious when taking
the other side. GREED is the number one emotion that MUST be
killed or the markets will wipe you out!
Just review my charts and
comments below and keep watching my current play sections as
I navigate through these uncharted waters and find the
trades that will make us lots of money!
Contrarian investing can be
the most profitable (short term) trading style, but trend
trading can have lasting increase in your profits. My
strategy is to trade in the direction of the trend and just
keep index puts rolling along as a cost of doing my
business. For the short term, I plan on adding more puts as
I make profits until the SPY shows me a clear topping
pattern. When a pullback happens, I will use that to look
for long opportunities.
The best way to sum up
this concept is to think of the markets as an object in
motion.
We know from Sir Issac Newton
that:
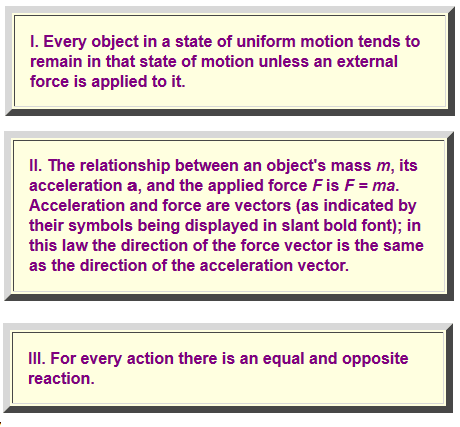
So how can we apply Newton's
three laws to the stock market? After all, isn't the stock
market more like rivers of organic cash flow moving into a
confluence of uncertainty? How can one know for certain what
the outcome of any event is when they put their money on the
line?
In relation to Law 1, we know
that markets have been steadily rising for nearly 8 months.
In relation to Law 2, we know
that all the indexes (m) have been
consistently accelerated by The Federal Reserve (a)
and its Monetary Policy (F)
In relation to Law 3, we know
that as long as Uncle Ben Benanke keeps on printing money
and injecting it into bonds, these markets are going to keep
powering higher!
So, when that inevitable
"greater external force" is applied, we know this house of
cards is going to crumble!
Now if you reverse the
equation, it looks like this:
When the current monetary
policy stops (-m)
Reverse acceleration begins
(- a)
If you are overweighed with
longs then your account can get = Fried
Until this happens, we need
to stay with the trend because it's indeed a true
friend...just cover your assets with protective puts!
Profits UP!

The donFranko
=======================================================================================
5/14/13 - Wow, a
super rally day in the markets and particularly the SPY.
This was the biggest one day move since Feb 2013 and the SPY
has now reached the upper end of my long term channel on the
weekly chart. Things are about to get crazy as we head into
May expiration.
I am going to place a Lotto
trade tomorrow because if this is the topping point, the
drop can start on Wed and last right into Friday.
An interesting statistic to
consider:
CNBC has a guest on today
that said:
"Usually, when we see these types of runs, 178 days or more,
none of them have ended with a bear market," he said.
"They've all ended – whether you looked at the '80s, the
'90s, the 2000s – with a 5 to 10 percent pullback.
On Squawk Box this morning,
comments from Hedge fund titan, David Tepper of Appaloosa
Management was chiming in that stocks are going HIGHER, and
he is definitely bullish! He referenced the movie My Cousin
Vinnie and made a comical comment that, "So like guys that
are short, they better have a shovel to get themselves out
of the grave."
This was the catalyst that
powered the markets higher today. Well, I do believe we are
in the new territory, frontier, never never land, but I also
know there IS going to be a correction, and that can start
this week when May expiration if over this Friday.
It has been widely known that
markets, "sell in May and go away" but that did not happen,
so I think this expiration Friday will be the final delay
and we get that May sell off in in the last week of the
month.
All I know is when CNBC has
the "big guns" coming on pumping things, you better be
looking for the exits for the short term.
I like to trade around the
Fibonacci sequence, so when I heard this news today about
the markets being up 175 straight days,
I did some quick math and
came up with an interesting coincidence.
Markets move, and they move
to the beat of the Fibonacci numbers more than anything
else.
3 + 5 = 8 (most of the time,
markets move around in 3 to 5 day cycles)
5 + 8 = 13 (occasionally the
markets will range trade up to 13 days before taking a
break)
13 + 21 = 34 (when stocks
trade into these ranges, they are extreme and correct in 1-3
days)
21 + 34 = 55 (once they get
into this range, the standard deviation models kick in)
34 + 55 = 89 (getting to
these ranges, it's usually because they are going parabolic)
55 + 89 =
144 (this range has the Bears falling all over themselves to
get short)
89 + 144 = 233 (this range is
where we are now, and this is unprecedented!)
Ok, so if you take 178 away
from 233 and you have
55!
If the markets are going to correct
10% as the CNBC guest suggested, then tomorrow or Friday
would be the perfect beginning. I think it is far more
likely we get a pull back than it is we advance to the next
Fibonacci level.
I know you can torture the numbers
enough that they will confess anything, but I just happened
to do the quick math while he was talking and this is what I
discovered...my hunches are usually right!

The DJ-30 Monthly chart reveals some
interesting things:

Profits UP!

The donFranko
==============================================================================================
4/25/13 - As the markets
make more highs, I am seeing the SPY struggling to follow suit, and it's
currently ready for another Bear 180, so I picked up some AprWk4 Lotto
Puts today, and I will buy some MayWk1 Lotto puts tomorrow for next
week.
It's always tough to take new long
positions when indexes are in sky high territory; everyone keeps harping
this just can't go any higher and yet it still does! As I said in my
recent market wrap, the Bears have pretty much waived the white flag at
this point; however, I do not expect them to jump on board the Bulls
train because they most likely view it as getting on at the caboose.
If you want to get long, then you have to
decide for yourself if you are going to jump on this train if you are
not already on it, or follow up behind this train with protective puts
if you are on it—if the SPY can get over $160, then this bull train is
poised to keep right on moving higher!
The daily chart has a very interesting
pattern to it. The last top was a perfect Bear 180 and now we have
another perfect Bear 180 set up, so look for the next red bar (NOTE:
that is not a gap over the last B180 high) and get short with a
strict stop at $159.90.

Options for next week:

We need to look deeper in time to help us
get a better idea if the current rally will sustain itself:

Looking over my ATR Bear 180 Calculator we can see how accurate my
predictions are:
Bear 180 #1
Bear 180 #2

Bear 180 #1 took three years to pull back beyond target 2.
Bear 180 #2 took only
ONE YEAR!
Bear 180 #3 is setting up,
but we still have up to 8 months for the SPY to show us a RED BAR.
Here is what the action looked like when
broken down to the monthly charts:
Bear 180 #1 Top
Bear 180 #2 Top 1
Bear 180 #2 Top 2

 
The SPY is currently in a strong up trending channel on all the
long-term charts and has now advanced into the top half. The next
resistance is $180 - $190, but it needs to get over $160 and close over
that into next year to be in a long-term continuation.


Profits UP!

The donFranko
============================================================================================

4/11/13 - Ok, I give
up...it's time to waive the white flag for the bears. The
S&P finally broke over all time highs and is officially in
new territory with nothing but blue sky to determine how far
it can go.
So what is next? Well, every
pundit on TV just sits like the deer in the headlights with
amazement. They just can't wait for the correction,
meltdown, sell off, pull back to happen. Sure, anything can
spark a stampeded for the exits and we are definitely at the
precipice of a continuation or major correction now that
earnings are in full swing.
Tomorrow is the beginning of the
fuse that can ignite or explode as the financial sector
(banks) start to announce. With the Fed hell bent to print
and dump bazillions on the bond markets, you know the stock
markets will just keep heading higher and higher. That means
any pull back will be less than 10% (at least the first one)
and then a snap back rally will ensue.
The only way I know how to gauge
this new frontier is to watch the charts, listen to news and
read a broad base of financial info looking for solid clues
and cues. I can tell you this, stocks have been trading
lofty levels off multiples of earnings; and if the earnings
fail (even slightly) they will fall father and faster than
they went up. Still, you have to trade the trend so just
keep index put protection loaded up as a cost of doing your
business.
I will be on the lookout for
individual trade ideas as there will be plenty of
opportunity on both sides as we power on through into the
new frontier!
Lets look at the charts:


==============================================================================================
3/11/13 - The markets are
about to approach the final hurdle in new index highs when
the S&P 500 reaches its all time high at 1576.09 set back
10/12/2007. Whatever the outcome, it's going to be
explosive—at least I hope it is. Looking over the weekly
chart below, you can see some very interesting things. Last
time the S&P hit its all time high of 1,576.09 was back on
10/12/2007. It put in a classic double top reversal signal
as well as trading into the very top of its long term up
channel. This time we are in the middle of the channel and
the rise has taken longer indicating more upside is
possible. When it rolled over last time, we just elected
Obama and now we are in his second term. Is this Déjà Vu all
over again? Is it coincidence that we are approaching the
all time high in the exact same month the index
bottomed...how ironic is that? Do you really think markets
are random acts? I know from years of trading experience
they are widely manipulated and controlled—especially around
pivot points and major tops and bottoms. With that said, you
have to step back and see the forest beyond the tree if you
want to position yourself in from of the action; and gain
the best possible profits for your trading accounts.
Charts are the guides, but they
are in no way the map to the treasure chests as you have no doubt heard, there
are plenty of charts at the bottom of the sea; and that is a
very poignant statement, so do not get married to "hype"
but
trade with diligent discipline on entry and exit points. As
we approach this benchmark, emotions will run high and so
you need to keep your eye on the VIX to gauge the overall
sentiment. Currently the VIX is approaching lows it has not
seen since 2005-2006 and if it does get down there, we have
the perfect storm setting up...the perfect MONEY MAKING
storm.
Crowd psychology, when it
comes to trading, is more powerful than any chart, technical
analysis or talking head on TV; and many times the crowd is
controlled by a heard mentality based on fear of loss or
greed . These two emotions will result in stampeding type moves up or down
and the investing public is always late to the party or complacent to leave when
they have too much of the spiked profits punch.
This is why we look to the VIX for clues on how the crowds
are getting spooked or emboldened. The higher the VIX
trades, the more fear there is in the crowd mentality and
the lower, the more apathetic or fickle the crowd can be
when it comes to buying. But when you have both firmly in
place, the markets can generate a stampede for the door or
the promised land of profitability—and for me that yellow
brick road is with PUTS.
So, if the VIX
manages to trade down to 10.00 and the S&P takes out the
current all time high, you better get ready to rumble
because this could be the bottom of the biggest run in the
history of the stock markets around the world.
The way I will play this
historic event is to load up on protective OTM puts at 2:1
or 3:1 of your total portfolio you are willing to put to
work and then get LONG. Just keep some cash ammo available
to add to the puts if this stampede turns into a fire sale
type barn burner because I anticipate an explosive move in either
direction is on deck in the next couple of weeks.


=======================================================================================
3/2/13 - As we start the
final month in the first quarter of trading, it's looking
like the markets want to clear the launch pad at DOW 14,000
and never look back. So far, we have had a pretty decent
earnings season with some awesome surprises and dismal
failures. What makes this particular earnings season unique
to me is the failures did not pull anything down and most of
them even rebounded and/or gained back most of their initial
losses. Of course this make everything VERY bullish and so
that is what I am; however, I am not willing to put it all
out there on the long side, I am just optimistically
bullish. What I know from hard learned experience, is
markets move and more often that than, they change direction
in a split second. That is why I will keep a running weekly
set of puts on either the SPY, OEX or TNA. If you have read
my past market wraps, then you know I have a decidedly put
bias because I know that when markets head lower, they do so
twice as fast and as far as they go up; however, markets
tend to rise steadily over a long time frame. As primarily
option traders, we look for volatility and movement to make
our profits. What we try to do is build longer term
positions with stock or LEAPS when we have winning trades.
Lately, I have been on the hunt
for more of my Lotto Trades because they have proven to make
thousands of percent returns that far exceed the cost of
fishing for them. The challenge with any account is do you
have enough money to cover the trading losses until the
winners roll in? If you do not, then you have to be a more
precise trader and look for consistent trading opportunities
to gain profits that will pay for your Lotto expeditions.
Ok, so what type of trades do
you need? You need easy and consistent ones of course; and
you will find those trading slow moving stocks with share
size. That is why I like to trade stocks such as: GE, MSFT,
ORCL, KO etc. These types of stocks have consistent trading
patterns are not subject to wide price swings like the APPL,
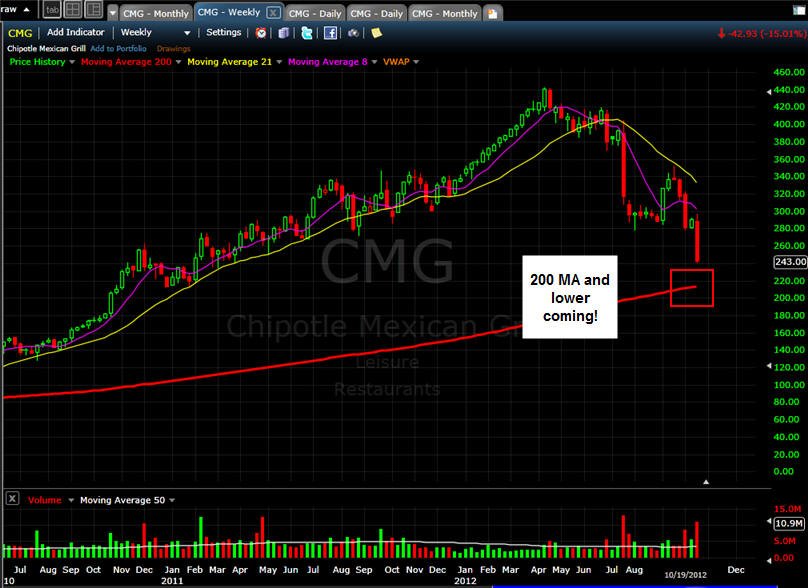
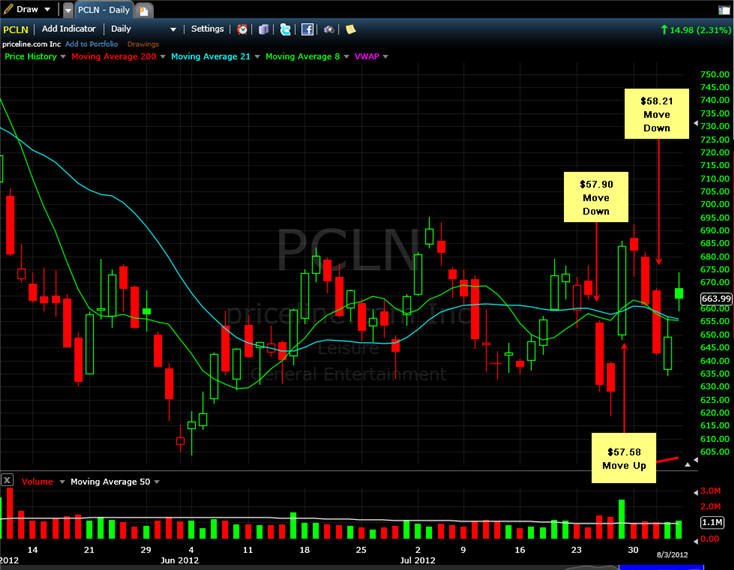
GOOG, NFLX, PCLN, CMG's of the trading world.
The next way I like to build my
trading accounts is by compounding my money at 20% per
trade. What I am saying is if you take a small amount of
capital like $1k and pick solid option trades, you can build
a pretty large account over the course of 20 successful
trades.
Both of these methods are
explained in my
training section so I encourage you to get some
education and then follow along as I post my trade ideas.
As this earnings season winds
down, I will be working on my Compounder trade strategy over
the next couple of months until the next earnings cycle
kicks in. Of course there will be plenty of weekly options
lotto plays along the way, so keep checking my current plays
section if you are a member and if not then be sure to
subscribe
today!
So, what is next on the markets
agenda? Up, down or sideways of course. To better understand
the potential next moves, we look to the charts for clues.


This first week of trading for
March is going to be a pivotal one and I will be ready on
both sides to capture as much of the movement as I can.
Profits Up!

The donFranko
============================================================================================
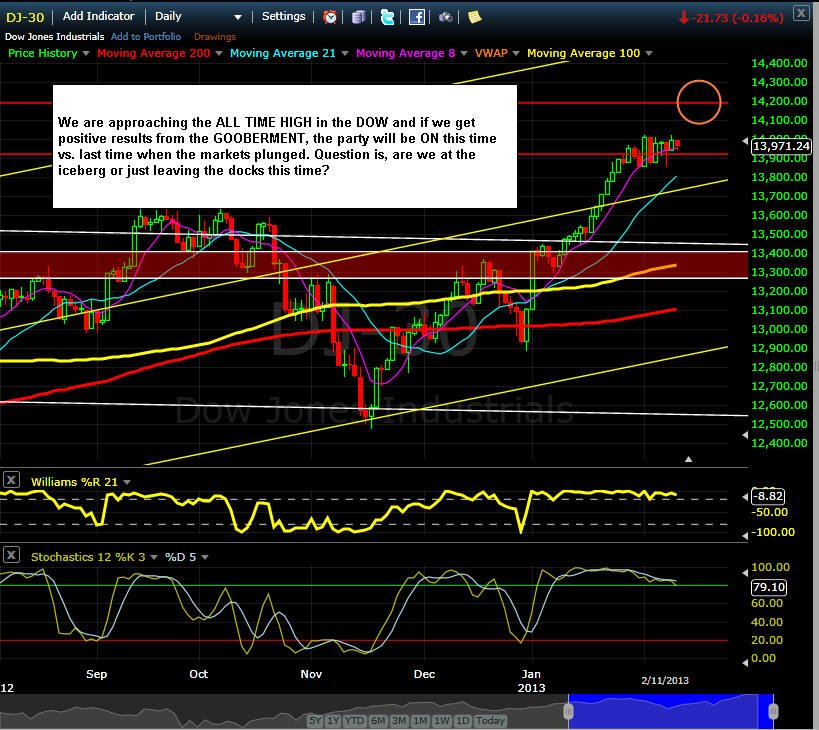
2/11/13 - What an awesome
earnings season so far! Last week we had another massive
opportunity with LNKD blowing the doors of earnings
estimates and launching the stock over 25%...WOW.
Unfortunately, I was not following that stock so I did not
have a play posted and boy do I regret that. I have now added it to my watch list and look forward to making plenty
of profits on this new rocket ride of a stock.
I shorted it today for a quick
profit to test the stock and so far, it's looking like it
just wants to keep moving higher. The stock closed on a
Fibonacci number (55) so that, to me, is code that a
definite direction is going to take place this week. Now
that this stock has entered new territory, we have to use technical
analysis to assist us on entry and exit points. Option
volatility will no doubt be packed in so you have to
carefully find your entry points and put in standing limit
orders for your exit points because if you try to micro
manage options trades, the swings in price will frustrate
you to no end—and any stop loss order you place will be
mysteriously taken out every time.

So far, Feb is turning into the
launch pad for new stock market territory and the bears are
salivating ready to pounce on any perceived correction. It's
always unpredictable when markets make new all time highs,
and most are thinking this just can't sustain itself. Well,
they may be right, but history has proven that mob
psychology is always wrong. The challenge for investors is
having either enough patience to find the best entry points
or enough capital to ride the swings as the markets prepare
themselves for a long term rise into the unknown. All I know
is that you need to be ready to get on board if you are not
already there. I plan on sticking with a long bias and just
adding DOTM puts on the indexes; because if this market does
fail, the drop will be massive and quick and you will just
not have enough time to get in good. It is very difficult, if not down
right impossible, to jump on a moving train or catch a
falling knife...your account will just get pulverized if you
attempt it.
I prefer to just accumulate
cheap put options with size; and if the demise of the
markets happens, I will be there with my nets to catch all
the fish that scramble for the exits!
Now if the markets do power
higher, the shorts will be panic buying and that will make
us solid gains as we are in the front car of this train
instead of the caboose like so many scared investors will
be—fortune favors the bold!
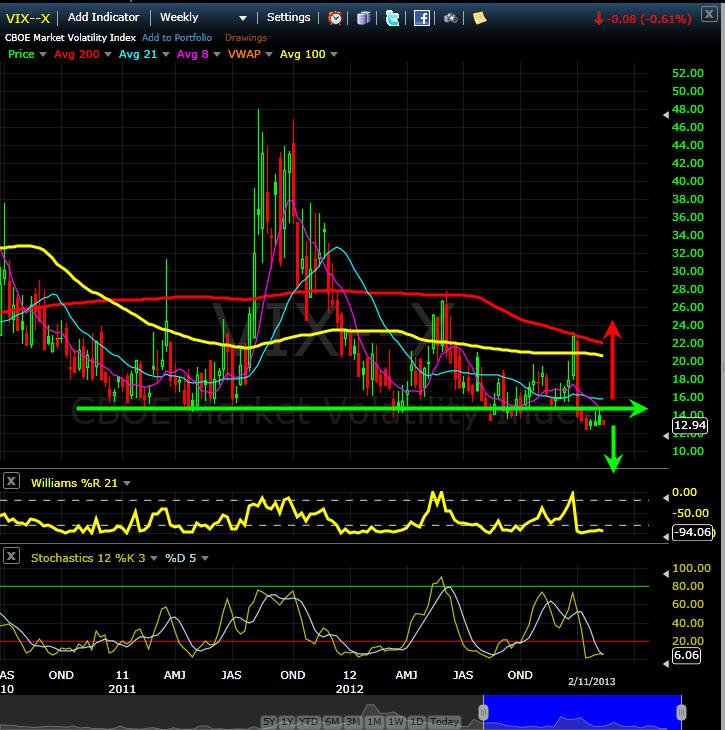
Keep your eye on the VIX; and so
long as it stays under $15.00, this market is going to keep
squeezing shorts higher and higher. I plan on keeping DOTM
puts on the SPY. In the past, the SPY has moved as much at
15 points down in a week, so I will keep weekly options 10
points out of the money. These typically cost .02 cents per contract
week to week and this gives you the opportunity to control a large amount for
a small investment risk; and if the markets crash, you BANK.
Start building positions with profitable trades as we get
bullish on the markets, that way, you
are fully hedged should things change suddenly for the
worse.


===============================================================================================
1/25/13- I am making a
change in my trading plan and primarily looking for LOTTO
TRADE opportunities! I hope my subscribers were able to jump
on the NFLX Mega Lotto ride and bank some astronomical
profits!! After seeing that happen, I am no longer
interested in fighting the markets for wins and losses. I am
just looking for the pot-o-gold trades and will stick to day
trading slow predictable stocks for daily profits to fund my
treasure hunting endeavors!
NFLX was one in a million, but I
know there will be more to come. Maybe not as good as that
one was, but with 1500-250,000% in potentilal returns, you
do not need too many winners to make you RICH!.
Look at what can happen to your
trading account when you hit one of these lotto trades:
NFLX Commentary

Sure these are gambling plays,
but hey, you can gamble in Vegas and make 1:1 may even 30:1,
but that's it and over time you will lose everything you
bring to the tables. Now compare that to what you can make
on these earnings options plays with weekly options and you
can easily see that your win to loss ratio is massively put
in your favor so just start out with small contract size and
build more as you profit!
I learned a valuable lesson this
week when I went back and looked over the JanWk4 weekly
options on NFLX. It was a right place right time opportunity
because nobody, even the market makers, believed NFLX was
going up that much. In fact, on Wednesday, the further OTM
options for the week were the JanWk4 125 calls. Well, had I
been closely monitoring them, I definitley would have bought
at the bare minimum 100 of them when they dropped to .02
cents and even by the end of the day of trading the were
only $0.34 cents each—Look above to see what the possibility
was for a mere $200 risk...WOW
All I know is this type of trade
is possible again, so I am concentrating on finding setups
to capitalize on and this week we have two opportunities,
well three, with AMZN, FB and RIMM. Will they make the kind
of returns NFLX did? Most likely not, but they still can
make you a bundle of cash.
The beauty about option trade
gambling vs. Vegas style gambling is you can play both sides
of a stock. You just buy Puts and Calls and that way you do
not have to try and figure out if you are going to be right
or wrong. All the stock has to do is move enough in one
direction to make you more than enough profit to pay for the
losing trade.
The mystery is what strike
prices do you buy to get the best possible chance of making
a profit? Well, if you want to go through years of
trial and error then start your process, but if you want to
get to the fast track, then
subscribe
and get access to my current plays section and get ready to
RETIRE!
===============================================================================================
1/21/13 - WE have sworn
in our president for his second and final term and what a
ride we are in for with this politician. Will the markets
put on the gas and head off into the skies or will it be a
sunset? Time is going to certainly tell us the whole story
but for now we have to do our best to figure out what the
charts are saying.
If history repeats itself, then
hold on to your seats because we could be in for a very
nasty ride down like we did when he first took office. If
you recall, that drop was over 6,000 points in 14 months.
The markets dumped because investors did not know what to
expect from this administration and times were much worse.
This time, we have had multi-years of Fed interaction
keeping interest rates down, printing money and shifting
policy to attempt a permanent fix for the future—Yeah, the
fix is in alright, financial collapse as we know it if you
listen to some of the pundits out there. I tend to agree
with them because common sense dictates you cannot print
money without backing or 100% confidence of the people to
keep using worthless paper as a means of trading goods and
services. Eventually it will come crashing down, and when it
does, the world is going to change in a big BIG way. For
now, the bias is to get long but you better have put
protection if you have a portfolio of stocks.


==============================================================================================
1/6/13 - Well the
world did not end on 12/21/12 and the Fiscal cliff has now
been abated with a new panic story...the debt ceiling.
With the upcoming presidential inauguration coming on
1/21/2013, we could see the markets make moves higher and if
earnings are solid, this could be the beginnings a new bull
market.
This first week of trading has
put on a strong push higher but managed a stop directly
under my trend lines I drew on the chart below close to a
month ago. This week will be pivotal as the DJIA approaches
a benchmark at 13,500. Until it makes a clean close over
13,700 I am suspect it will be new territory for 2013.
The daily chart shows that 12/21
had no real effect on the markets direction but the Fiscal
cliff sure did. As you can see in the daily chart below,
there was a clear Bull 180 reversal and it powered up
solidly passing the ATR of this setup. I typically consider
this to be very bullish and so long as the DOW holds 13,300
I am bullish on the DJIA.


====================================================================================================
12/19/12 - We are fast
approaching the end of the world this Friday, well,
actually, it would be more like Thursday night for me since
I live in PST and the sun rises in Japan when I am going to
bed. Hmmm, wonder how the Mayans calculated that when they
did not know the world was round...or did they? After all
their calendar symbol is round right?
 =
=
 =
=

The proverbial doomsday clock is
ticking down and if the world is still turning on
Thurs/Friday, I think we could see a nice relief rally in
the markets.

=======================================================================================
12/15/12 - I have been
very busy trading and have not had time to update my market
wraps but I will do some catch-up today.
Last Post I said GOOG would
indeed hit the 200MA on a pullback and I was 110% accurate!
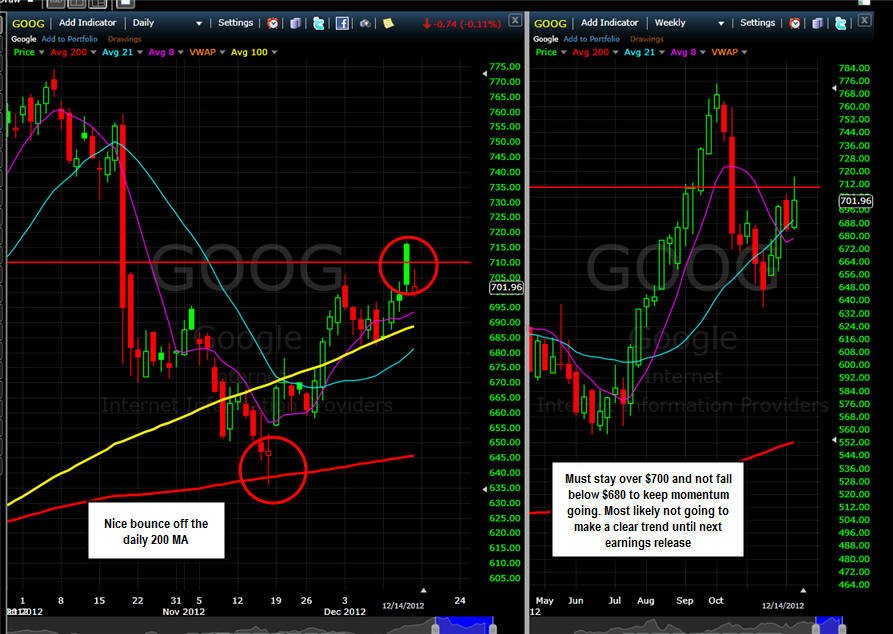
Next we look at the DJ-30 chart
and see if there will be a repeat of the last presidential
election meltdown.
==============================================================================================
Update: 11/14/12 - As I thought
back when I wrote the GOOG comments below, it will hit the
200MA

DOW JONES Chart Update - read
the full analysis below


Profits UP!

The donFranko
|


 =
=
 =
=


