|
Option Trading College
Subject:
The Bull & Bear 180 Pattern |
Entry is Key...Exit is Everything! TM |
|
The
Session 1 – Patterns Repeat: History repeats itself and so do stock trading patterns! How do you find the perfect fishing hole where the big fish like to swim? Generally, you either search for a very long time or you find an old angler who knows the way. Well, I am going to teach you some VERY powerful trading patterns that are sure to make you very large and consistent profits! Based on proven history, people are predictable for the most part. They like to follow a trail as if they were ants. It amuses me to see how easy it is to start a trend and thousands, if not millions of humans will just get in line and follow the scent laid in front of them without question. I certainly know YOU are not a typical ant-minded human simply because you are reading these very words...congratulations for being awake and ready! Trading anything, especially rapid micro trading, requires undying discipline, knowledge, fearlessness and a clearly defined plan in order to succeed. Most traders disregard all these basic rules of the game and just jump in and out looking for the quick and easy profits; never realizing that loss after loss will compound until they have no more trading capital—I know from real world experience what pain that can cause. What if you could find a way to accurately predict patterns that work better than 80% of the time? How would this information help you achieve your trading goals? There is no perfect pattern, well, maybe there is, that can give you a perfect profit; however, there are several that have very consistent movements that you can rely on. The key to these patterns are your entry and exits. If you master the entry, the exits will result in gain, after gain, after gain! Below I will reveal all of the secrets to the best trading holes where the biggest profit fish swim!
|
|||||
|
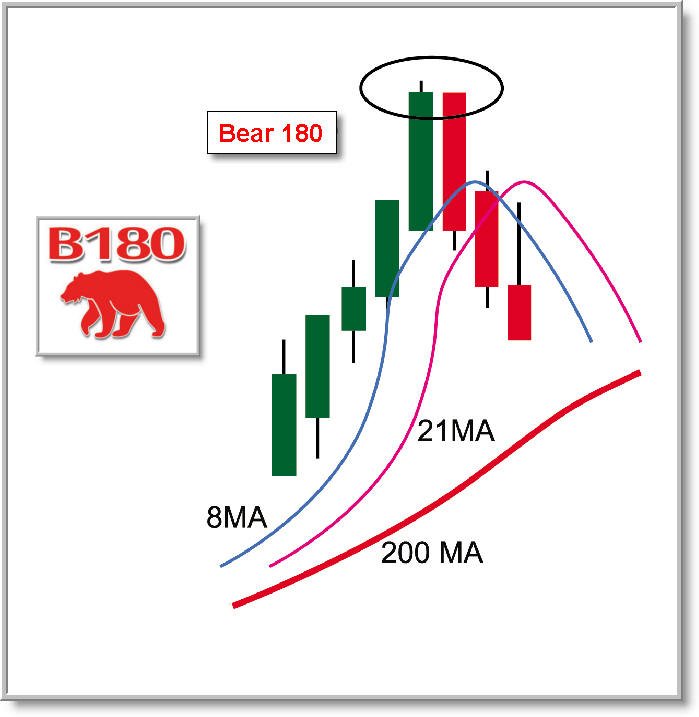
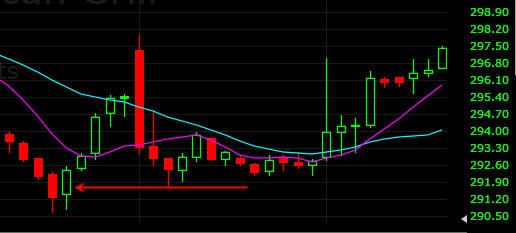
Session 2 – The pattern to look for: Trading on emotion is the quickest way to the poorhouse, but trading on known winning patterns is the only ticket to the cashiers window! When you look at all the stock patterns to trade off of, you can become quite overwhelmed with the choices. In fact, if you start to delve into learning them, you will no doubt become a discouraged and confused trader; always chasing your money and never benefiting from the efforts to find these patterns and then execute trades properly. I can teach you a lot of patterns to look for, but I want you to FORGET everything you think you know about patterns and trust only this one! Why? Simply, because it works better than 80% of the time! Once you learn how to recognize, and then trade this pattern, you will think you own a money printing machine because it can make you a fortune over time as you master them—then you can compound your trading profits with more size and grown your account exponentially! The first thing you need to do is learn that patience is the key to making money consistently when trading stocks, and more importantly, if you are trading options because you have very little room for error—especially if you are trading weekly options. Never try to "force" a trade because you are "thinking" its going to happen. Never have opinions...they are the death nail to any trading plan—we trade this pattern based on math and discipline! When you are trading this pattern, you need to just let it happen in order to make them successful. Below is the basic setup you are looking for.
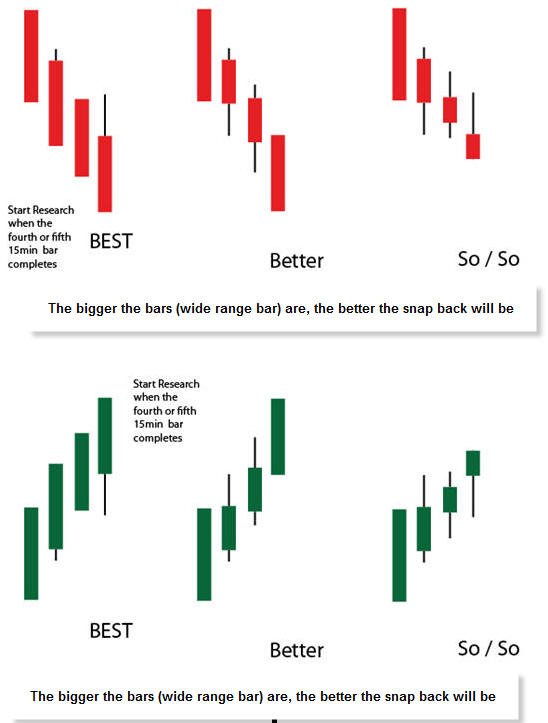
Here are the patterns that you should base your decisions on:
This particular pattern is simple to spot and easy to execute on 15 or 30 minute charts. It rarely fails, and if you are not greedy, it will make you a very nice profit over and over again—it's the equivalent of Printing Money!$! You can trade this pattern on every time-frame; however, trading on 5 or 1 minute charts requires extensive experience, capital and enough movement in the stocks price to cover the commissions; and unless you can control 500 or more shares; I DO NOT RECOMMEND you trade them on anything less than 15 minute charts. If you are trading options, then you MUST use 15 or 30 minute charts; however, I strongly suggest you only trade options with this pattern on daily, weekly or monthly charts until you are very successful with trading stocks. I do not recommend you day trade with options unless you are very experienced and can buy enough contracts ( 5 or more) to cover the commission with a small move in the option price—buy options with a Delta of .70 or greater for best results. |
|||||
|
I prefer to trade high beta stocks like GOOGL, AAPL, AMZN, BIDU, CMG, CMS, WYNN, PCLN, TSLA, NFLX, NVDA, FB, BABA etc. This strategy works on any stock; however, smaller stocks have smaller moves, so your profits are minimal unless you can purchase a large amount of shares. If you are trading options with this strategy, then you definitely need to trade the high beta stocks because you need the price movement in the stock so the options move enough to cover the cost of commission and option price spreads and slippage; however, the swings in your p&l will put you to the test, so if you do not have a very high tolerance for draw down, then stick with stocks when day trading options on B180's.
FOLLOW THESE RULES EXACTLY AS I HAVE THEM LAID OUT FOR DAY TRADING:
IMPORTANT: Once you have been filled, stick to your stops with 100% discipline!
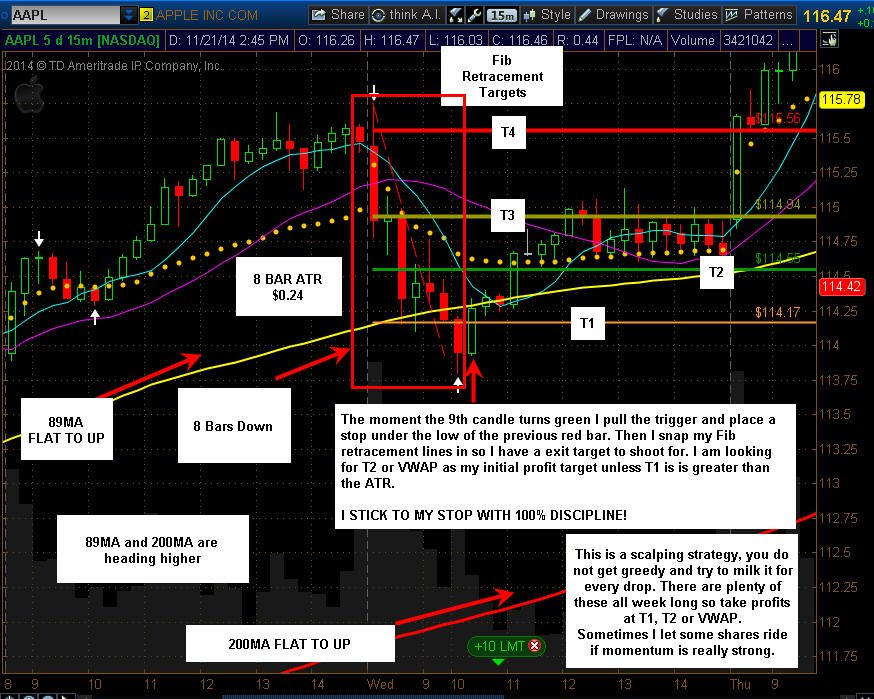
Here are the setups I use in TOS for B180's (you do decreased for Bull and increased for Bear 180's):
Here is the Fib retracement settings I use:
Here is a recent 15m Bull 180 on AAPL that I traded:
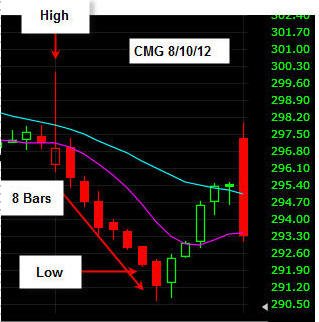
NEVER get greedy with this pattern. It is for "scalping" profits during the trading day and not for buying and holding. It can and will fail several times, so do not attempt to milk it for every cent of profit with your full lot of shares. Below is what can happen if you get greedy:
As you can see, had you not taken your profits by the end of the trading day, CMG pulled back dramatically the next day and almost wiped out all of the gains! There will be plenty of of these all week long; and if you practice sound discipline on your stops; then you WILL make profits over time—it's a number game not a pinch hitting strategy.
Following the above criteria is one piece of the puzzle. In order to get the most out this pattern you have to do your due diligence on any stocks you are not already very familiar with. Trading on pattern recognition alone will result in more stop outs than profits, so be prepared and make every trade count!
Trading Decision Levels: 1 – Lowest odds of success (10 - 25% of buying power) a. Trading pattern only
2 – Good odds of success (25-50% of buying power) a. Stock daily chart is UP for long plays and DOWN for short plays b. Stock Sector is UP / DOWN c. Market is UP / DOWN d. 180 Reversal bar opens at or very close to the close of the last bar.
3. BEST odds of success (50–100% of buying power NOTE: use margin at your own discretion) a. Stock daily chart is UP / DOWN b. Sector is UP / DOWN c. Market is UP / DOWN d. The 180 reversal bar is at least the ATR away from the 8ma or 20ma. e. Earnings are one – two weeks away and the company BEAT last time and has a history of beating estimates for bullish plays and the reverse for Bearish plays. f. There is supporting news to move the stock: multiple analyst upgrades or downgrades, wining contracts, Government support, FDA approvals, management change, lawsuit impact, strong or weak PE ratio etc.—know the fundamentals of the stocks you trade. g. Volume is 2:1 above average.
RULE 1: Once you are in the trade, you MUST place a hard stop within .05-.10 cents of the bottom of the reversal bar.
This stop is non-negotiable and MUST be adhered to with 100% trading discipline!
REMEMBER, you will have setups that
will fail, but you will have many more that will result in a
profit, so do not worry about the losing trades; just keep
searching for the next candidate and you will be profitable over
time.
RULE 2:
Once the next 5 or 15 minute bar has
closed above the last one, move your stop up accordingly.
RULE 3:
If your trade has resulted in a 55%
retracement of the setup range or the ATR, either move the stop to a trailing stop
or take a minimum of 50% of the trade off and lock in the
profits!
PIGS GET FAT...HOGS WILL ALWAYS GET
SLAUGHTERED!! If your trading platform does not offer scanning then I highly recommend you subscribe to www.worden.com and use their Stock Finder software to get live intra-day scanning for these pattern setups. This will save you a ton of time and make you a lot more money!
Here are several examples of the pattern:
|
|||||
|
I am now offering private mentoring during live trading sessions. email me if you want to discuss this.
Profits Up!
The donFranko
6/21/20 |
|||||


